
How Many People Are Coming to the Uk and How Many Are Leaving?
The charts in this briefing paper give you some numbers on immigration. The first two charts give information on the number of people who arrive in the UK or leave the UK each year.
1. Immigration to and emigration from the UK since 1964, in thousands
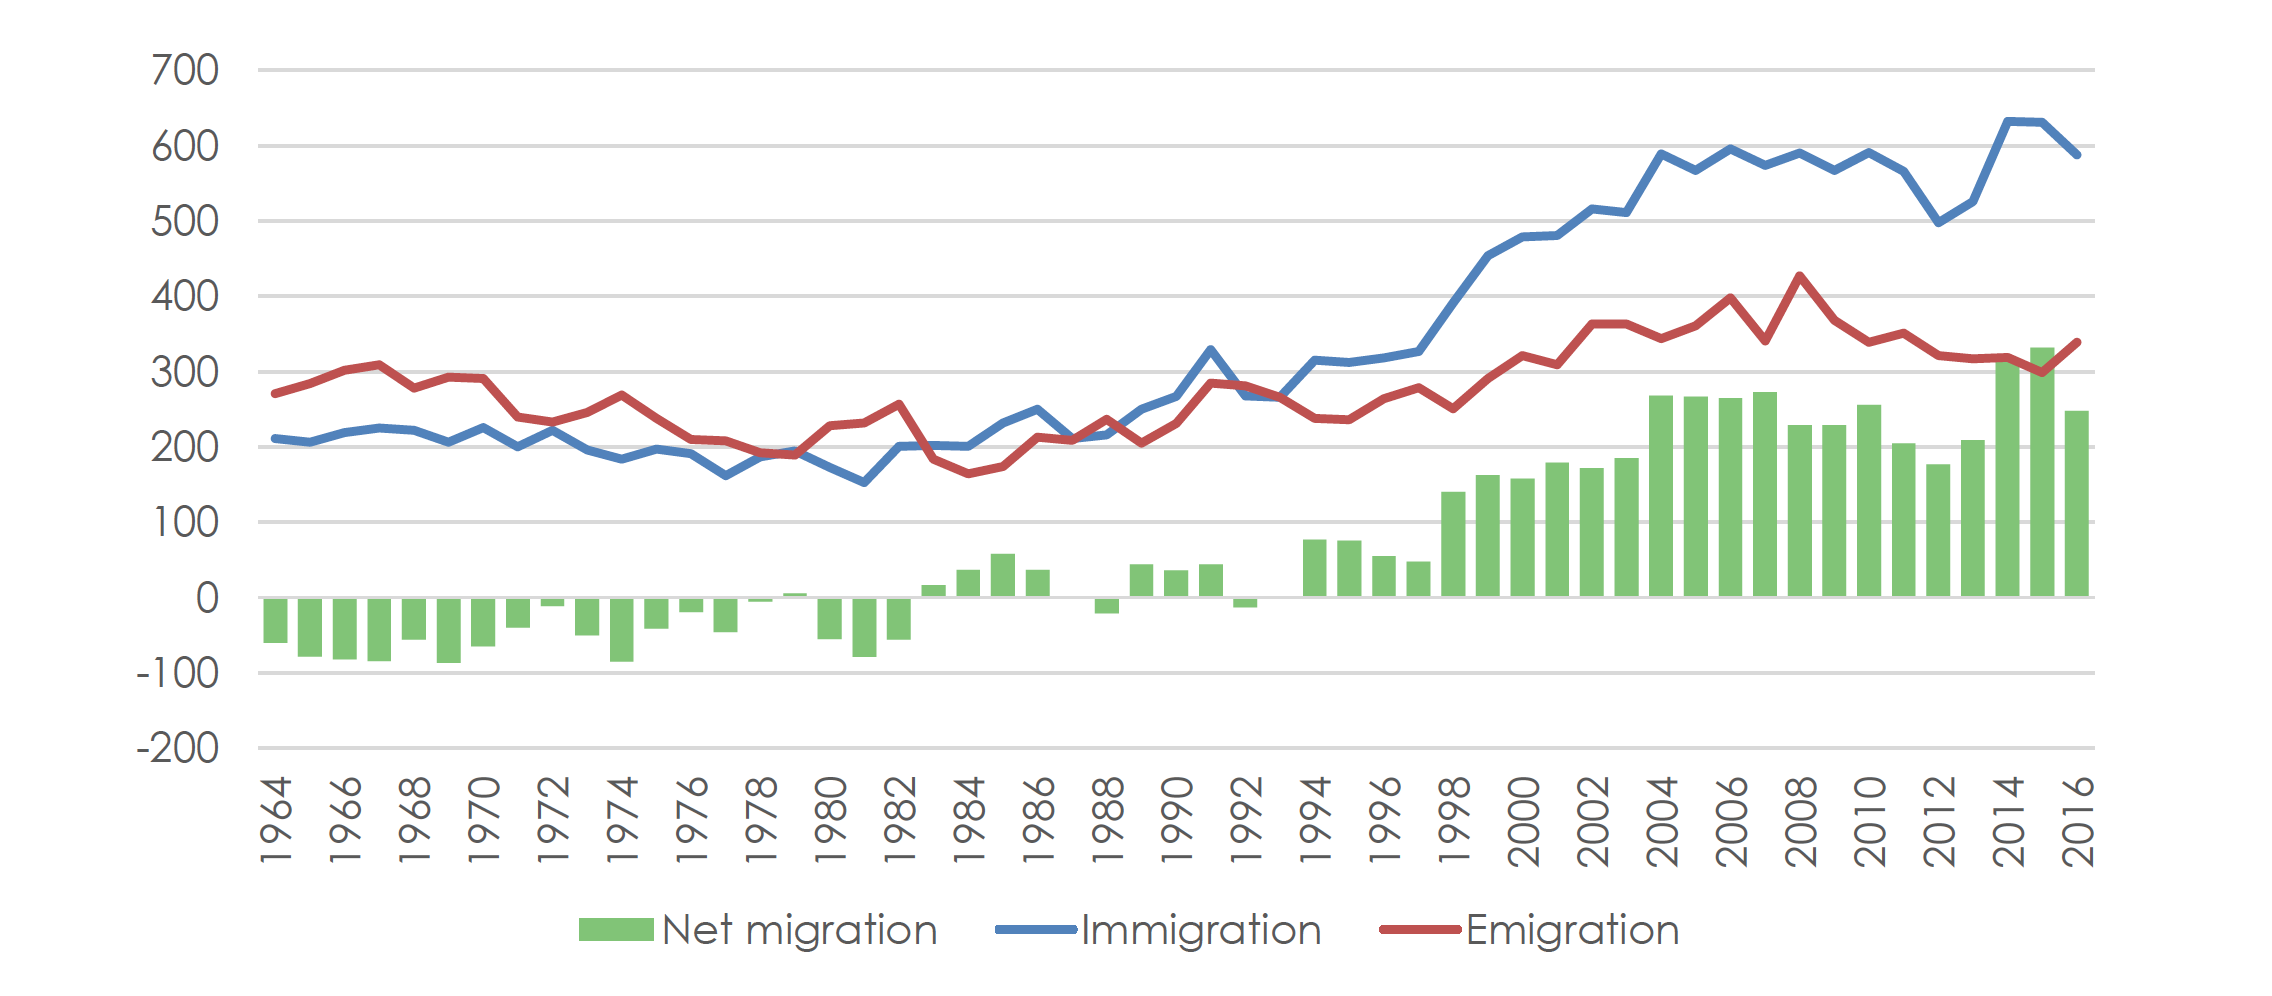
Source, Office of National Statistics.
This chart shows the number of people who have immigrated to the UK or emigrated from the UK each year since 1964. It also shows the difference between these number. This is called ‘net migration’.
The number of immigrants to the UK is shown by the blue lines. This increased between the mid-1990s and mid-2000s. The number of people emigrating from the UK is shown in the red lines. This has changed less over time.
The green bars show net migration. A number greater than 0 means that more people came into the UK than left. A number less than 0 means that more people left than came in. In the 1960s and 1970s, more people were leaving the UK than arriving. Things evened out in the 1980s. Since the 1990s, more people have been arriving than leaving. Net immigration has been higher than 200,000 in every year but one since 2004.
2. Net migration of UK citizens, EU citizens, and non-EU citizens since 1975, in thousands
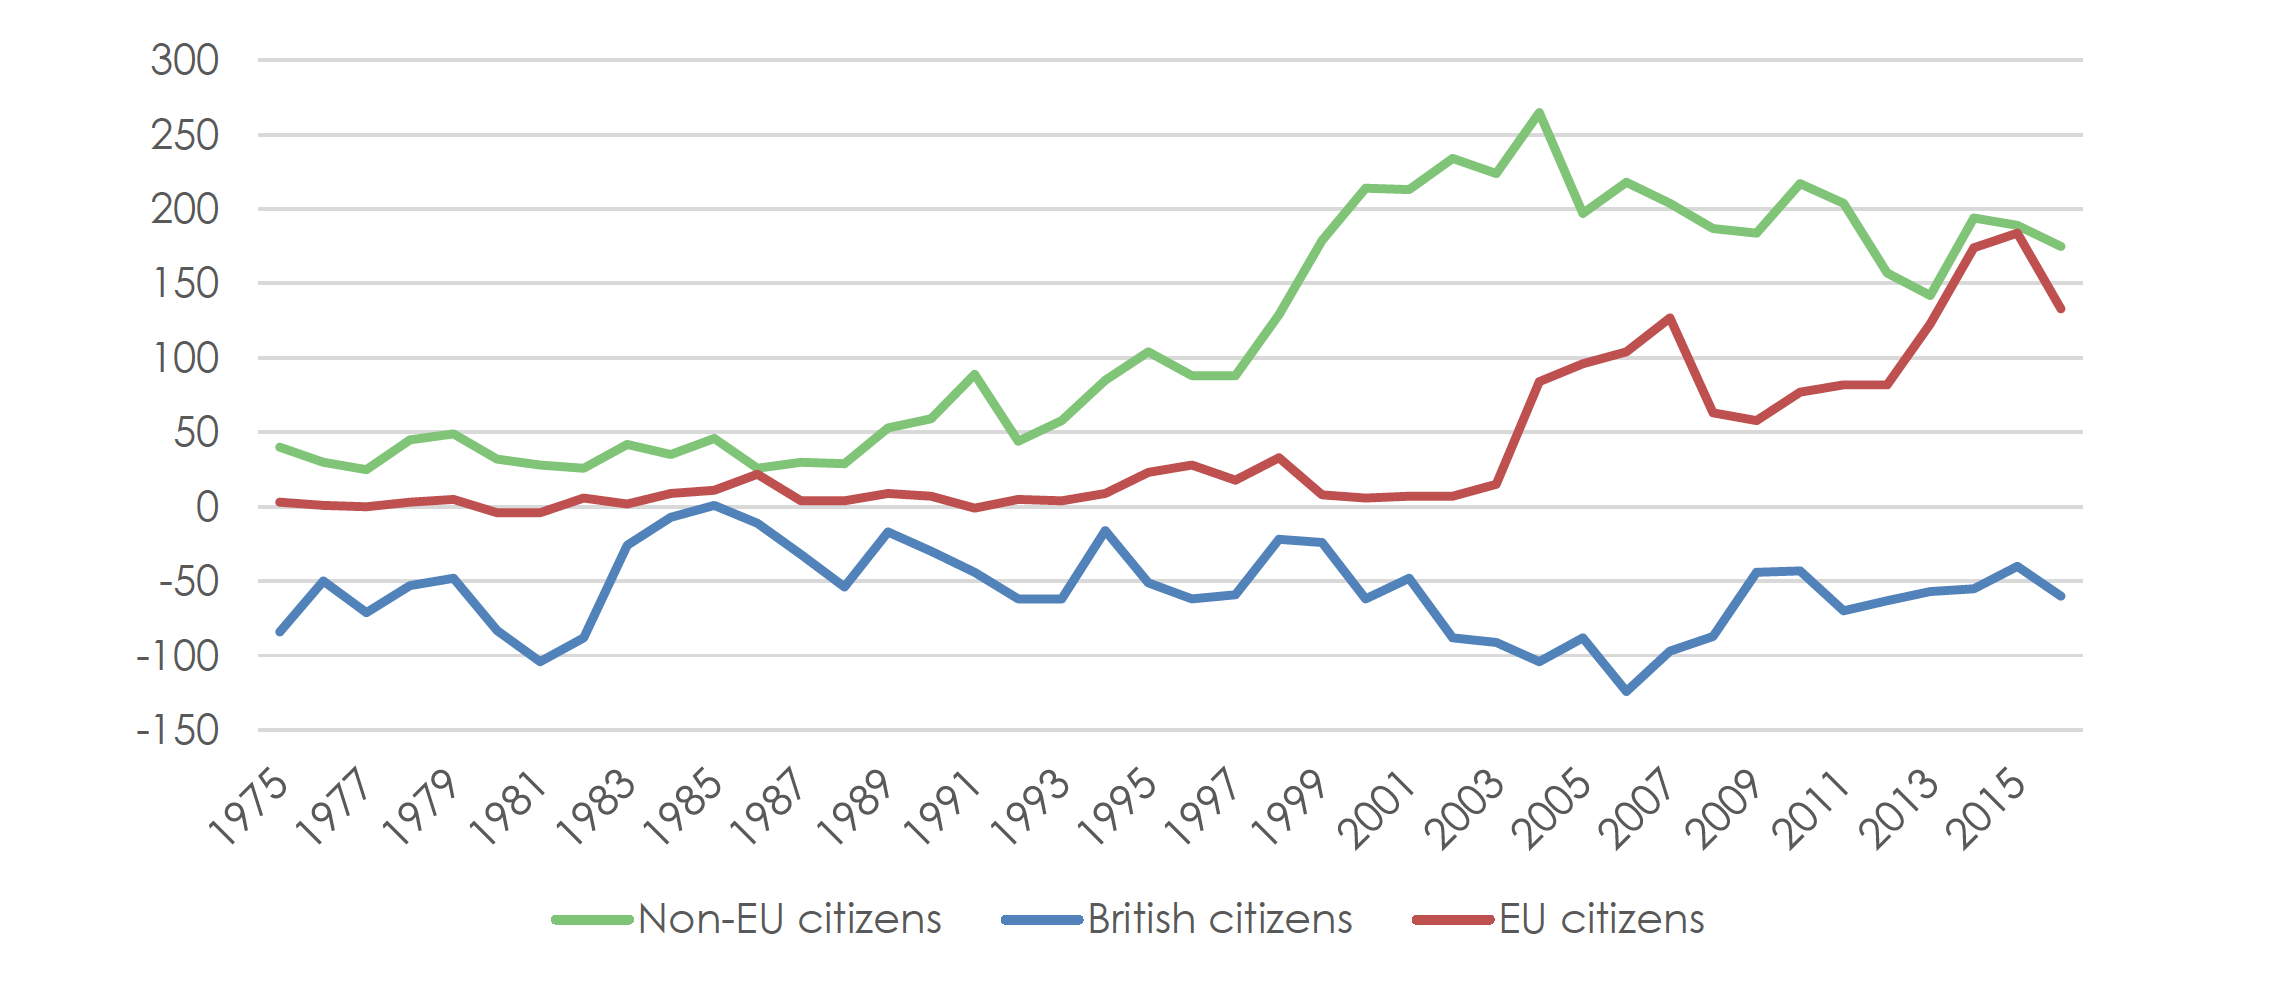
Source: Office of National Statistics
This chart shows where people moving to or from the UK are originally from. Some of them are British citizens, others are citizens of EU countries other than the UK, and others still are from outside the EU.
Numbers greater than 0 mean more people are arriving than leaving. Numbers below 0 mean more people are leaving than arriving. The numbers show that, except for one year in the 1980s, more British citizens have left the UK than have come in. The opposite is true for people who are not British citizens. There have been more non-EU immigrants than EU immigrants every year.
Who Lives Where?
The next three charts give information on where people are living. They give information about people living in the UK who were born abroad and about UK citizens who live abroad.
3. Where people living in the UK (in 2016) were born

Source: Office of National Statistics
This chart shows the percentage of people living in the UK in 2016 who were born in the UK or in another EU country or outside the EU. It also shows these numbers for each part of the UK.
86 per cent of people living in the UK were born in the UK, 5 per cent were born in another EU country and 9 per cent were born outside the EU.
London is different from everywhere else. 62 per cent of the people living in London were born in the UK, 12 per cent were born elsewhere in the EU, and 26 per cent were born outside the EU.
Wales and the North East of England are the parts of the UK with fewest immigrants. 94 per cent of the people living in both areas were born in the UK.
4. Which country immigrants living in the UK (in 2016) are from, in thousands
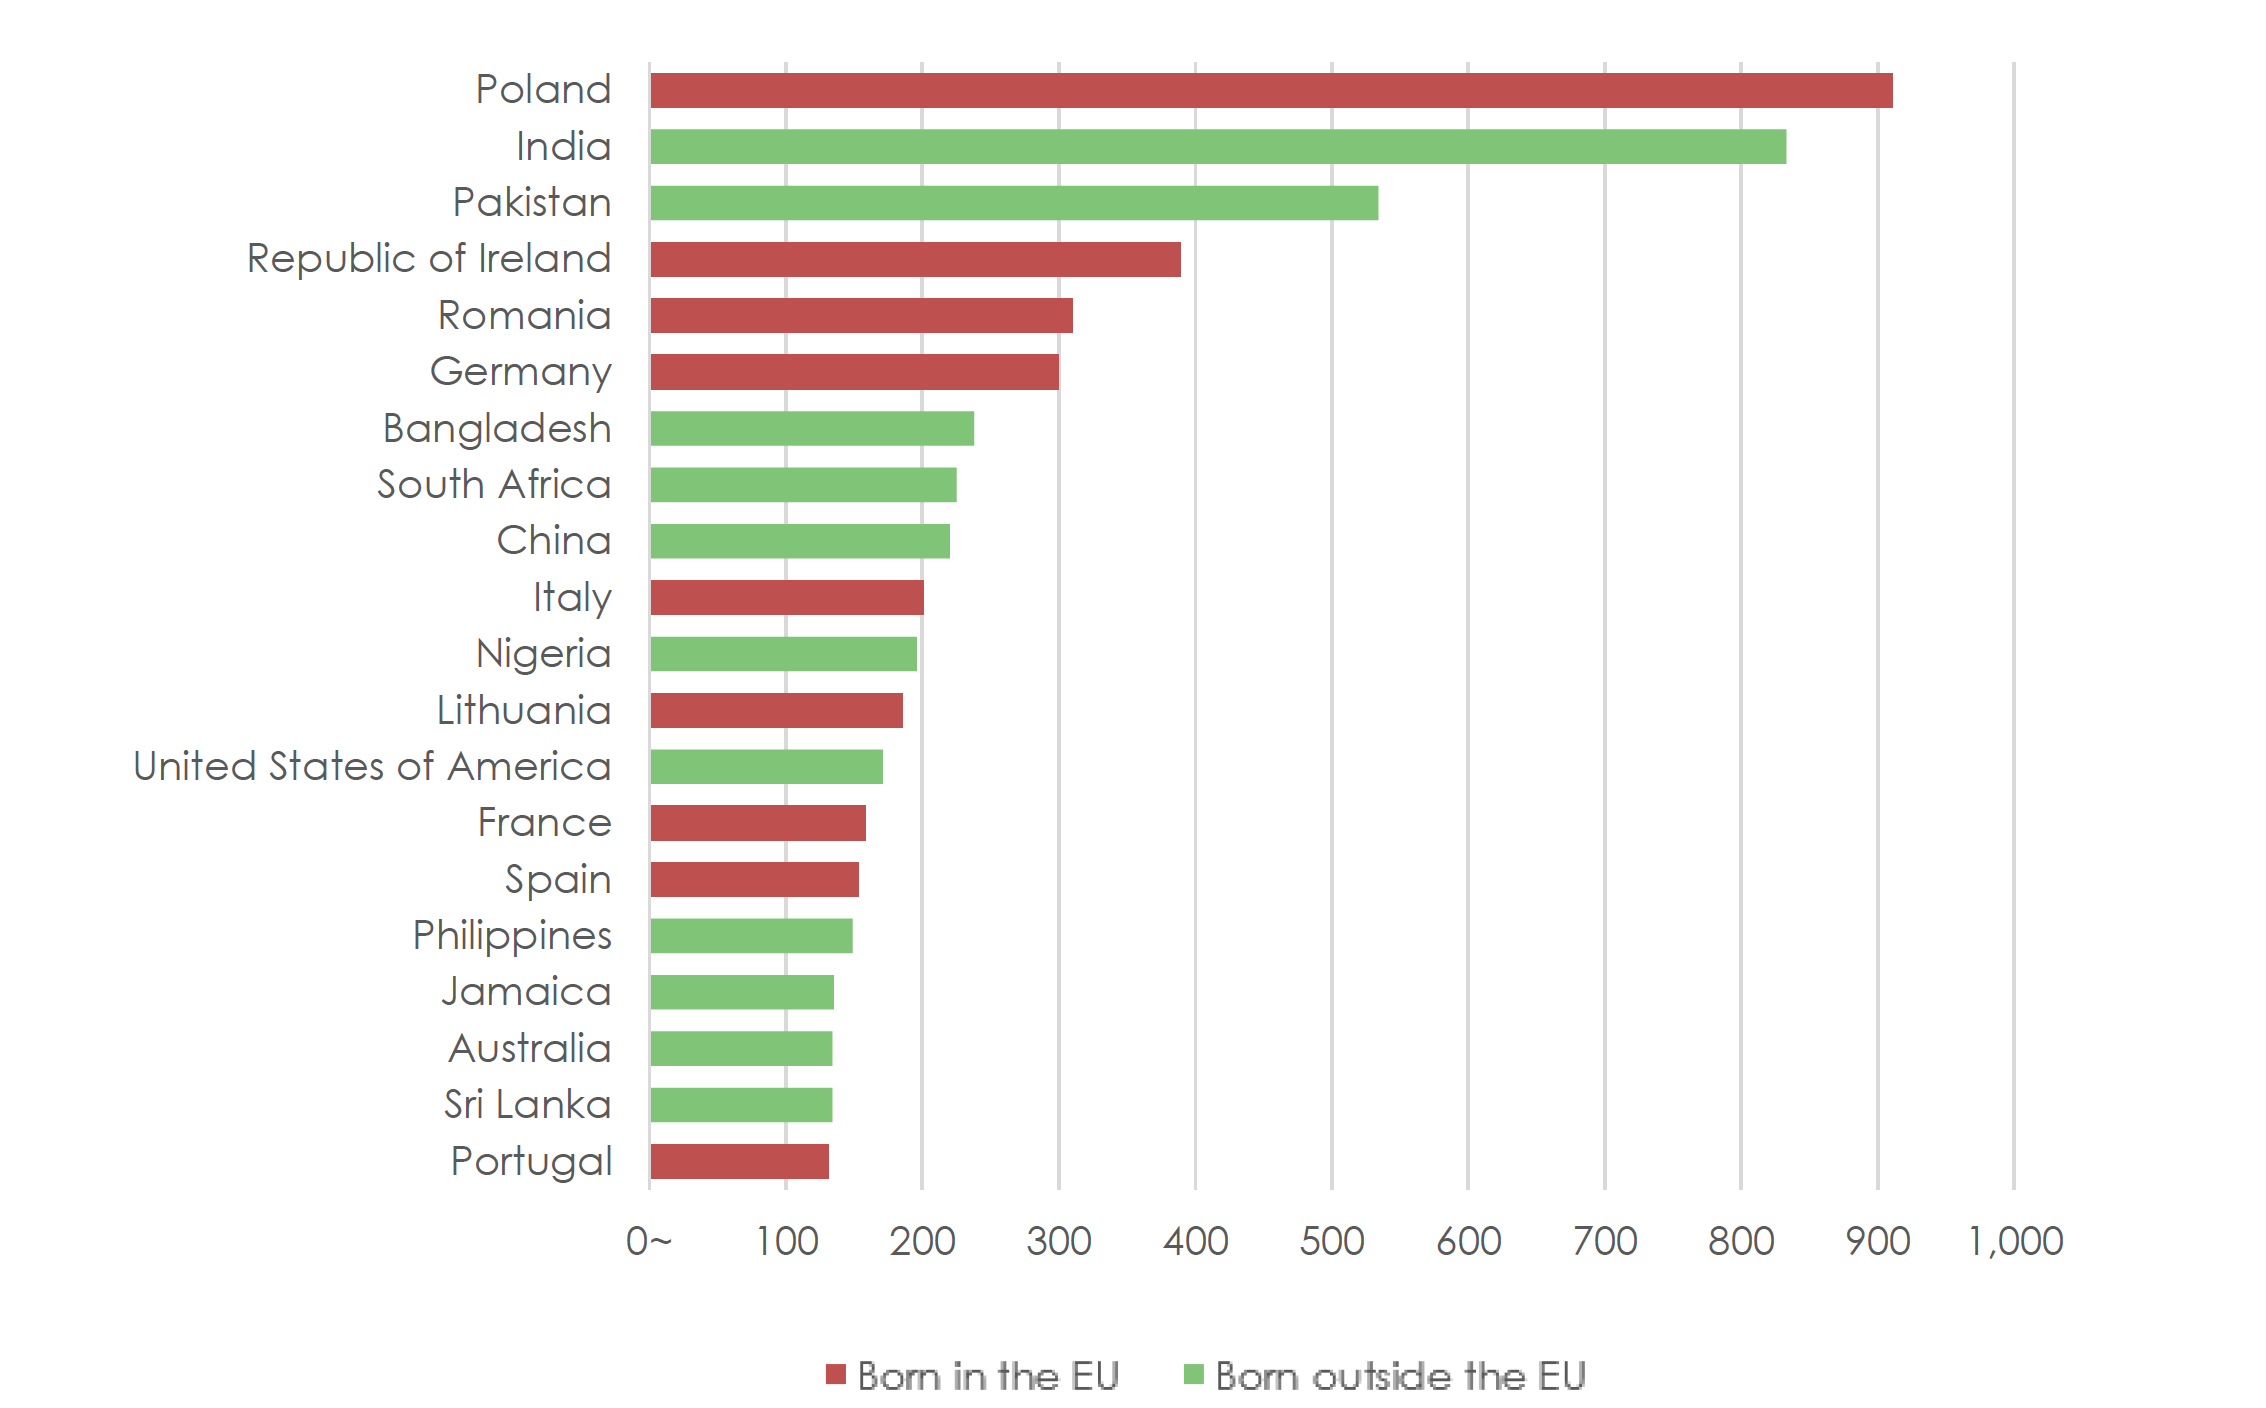
Source: Office of National Statistics
This chart shows the number of people living in the UK in 2016 who were born in different countries. It shows the 20 countries with the largest communities living in the UK.
The largest group are people from Poland. There are over 900,000 people living in the UK today who were born in Poland. The next largest group – over 800,000 people – come from India.
5. British citizens living abroad (in 2015)
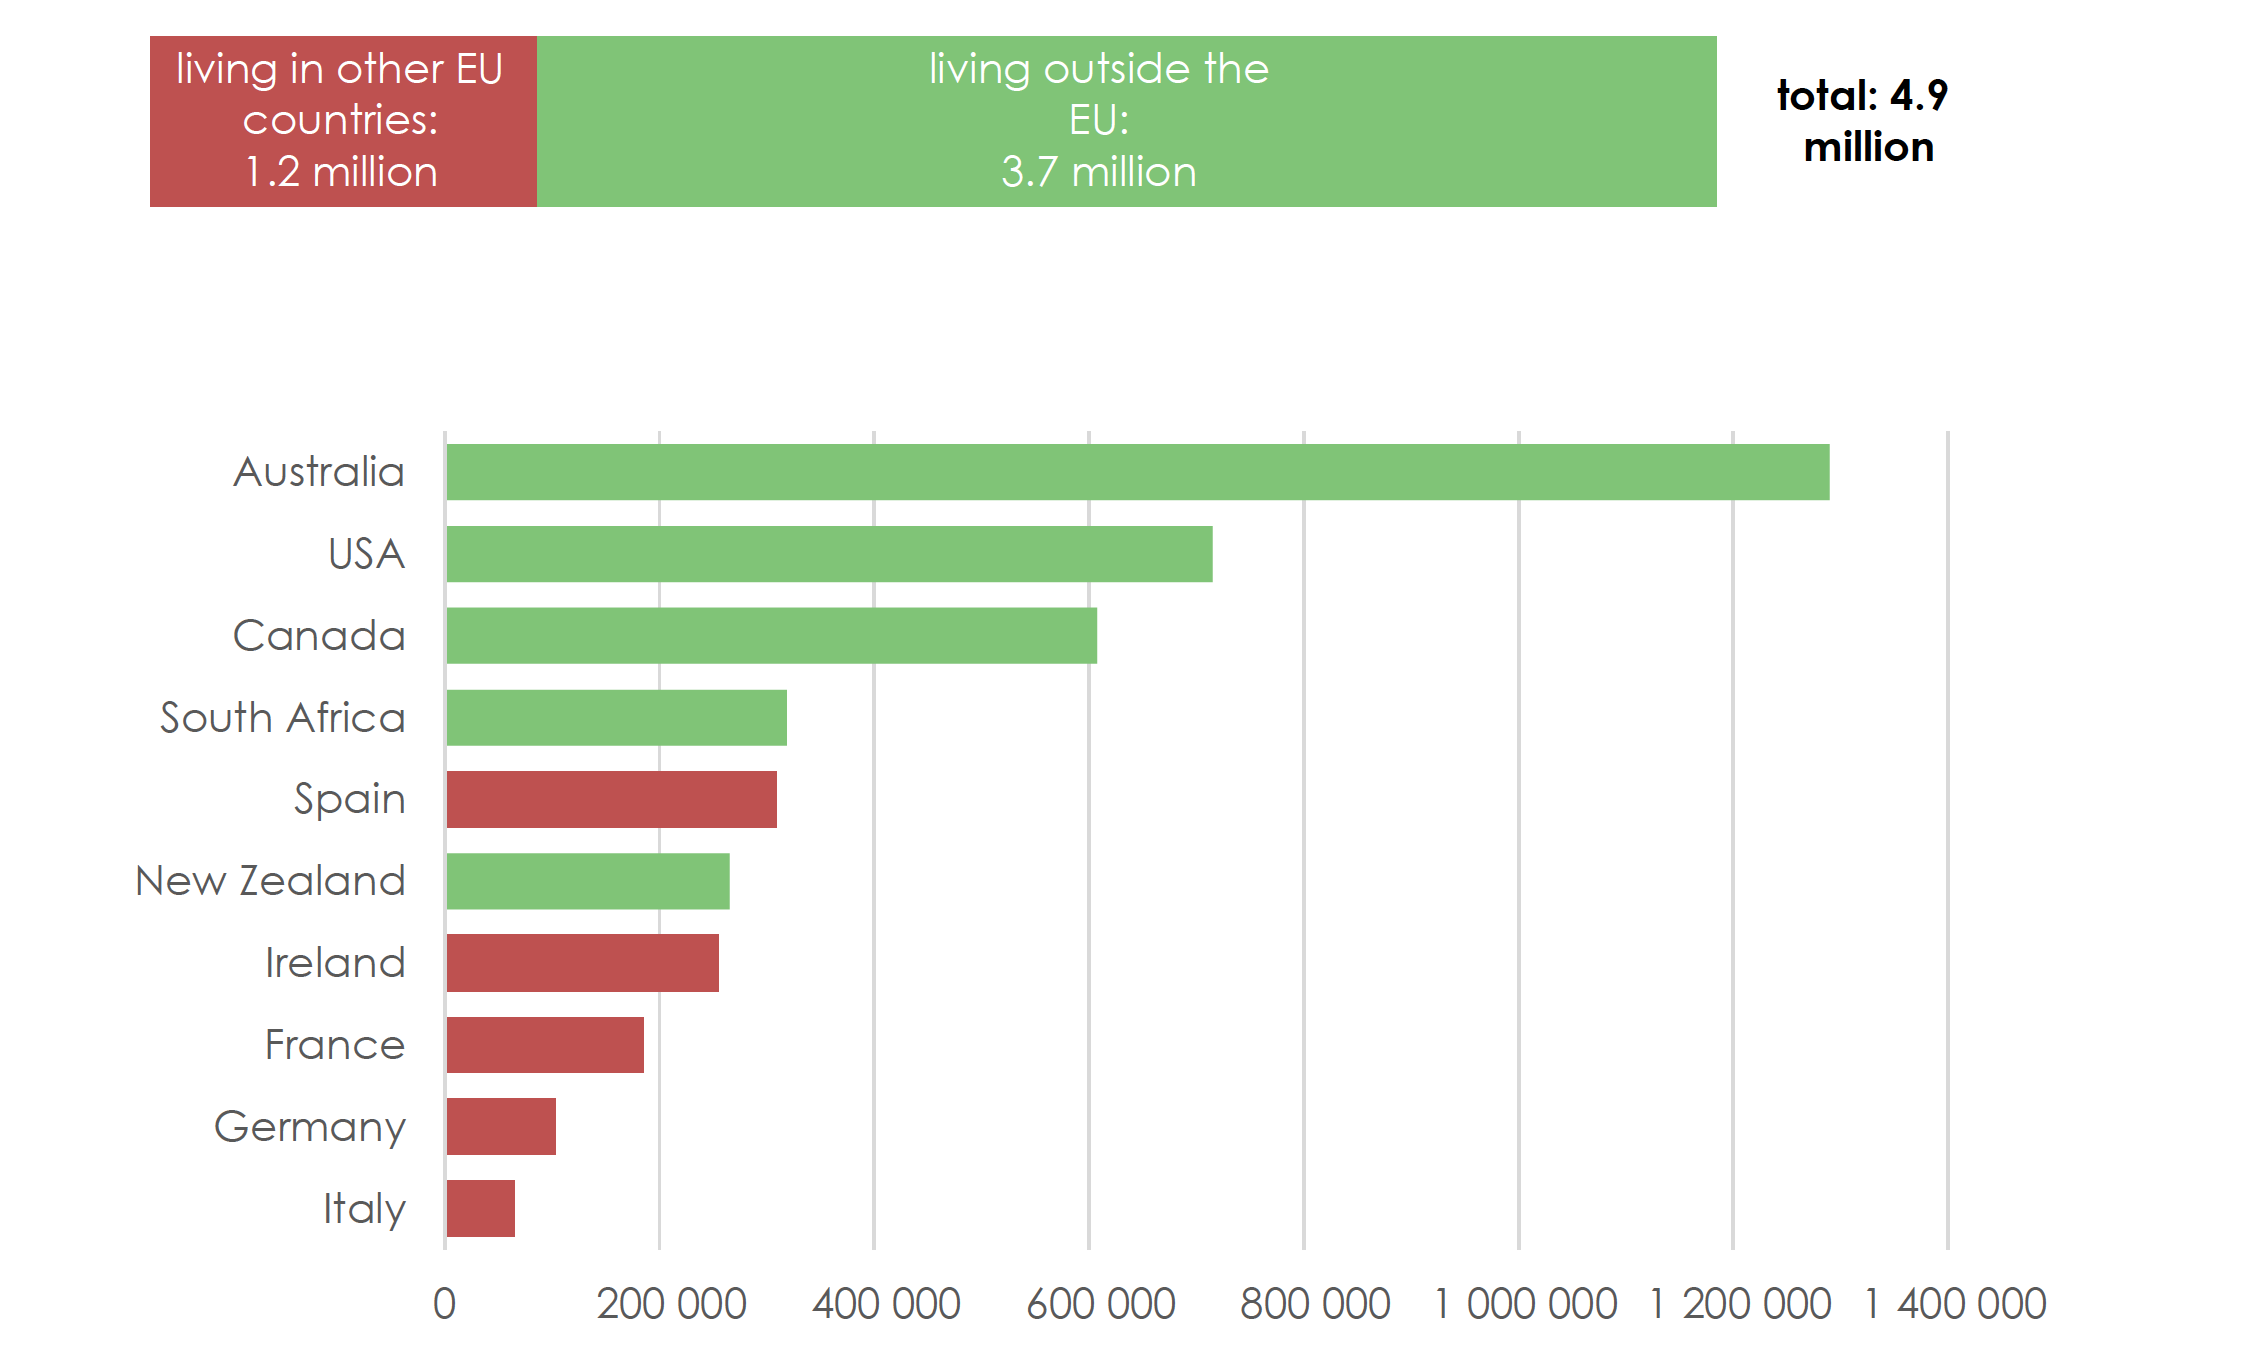
Source: United Nations Population Division
These charts give information on UK citizens who live outside the UK. The UK government doesn’t collect this information, so these are estimates by the United Nations. The estimates are for the year 2015.
The chart at the top of the page shows that an estimated 4.9 million British citizens live outside the UK. About 1.2 million of these live in EU countries.
The second chart shows the top ten countries in which UK citizens live. The largest number of UK citizens – over 1.2 million – live in Australia. The most popular EU country for UK citizens is Spain. There are over 300,000 UK citizens living in Spain.
Download 2-3 Immigration – The Numbers